A Short Guide To Technographic Data And The Information It Provides For Retailers
Data gathering and analysis play a significant role in modern business. As big data and cloud technologies continue to grow, so does the importance of data. Companies are turning towards centralized data storage and collection.
Making the most of all the data that enters a business is crucial. In other words, modern companies need to make the most of their stored data in CRM systems. They must analyze that data and deliver it in an easily-digested manner.
The use of AI and big data has made categorizing this data accessible. However, data is only helpful if you can extract valuable insights. You can break it down in many ways to get beneficial information; technographic data is just part of the extensive data spectrum.
How big data fits into modern business
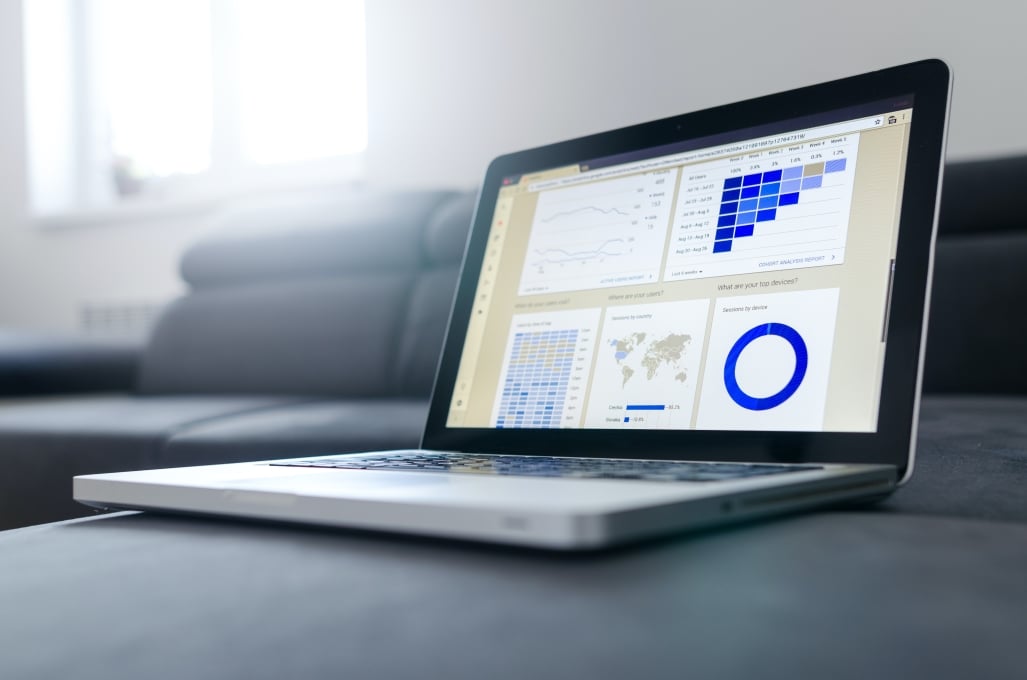
The term “big data” collectively includes data software analytics, centralized data management, data storage, and cloud technology. These technologies are relatively new, but they allow companies to crunch numbers in minutes that would require analysts weeks.
These software solutions are especially adept at recognizing recurring patterns in extensive volumes of data. All information about customer buying habits, demographics, usage statics, etc., is added to the software for data segmentation and identifying the most important trends.
This approach has proven useful in various fields, including digital marketing, ecommerce, B2B business, etc. Companies in different industries use tools like SaaS marketing software, inventory management tools, and CRM systems that rely on data to provide valuable insights.
What hides behind the term “technographic data?”
At its core, technographics is a type of market segmentation. The term represents market segment by the level of technology the target audience uses. Technographic data contains information about technology usage, adoption rates, how people are finding new technologies, etc.
It depends on whether the data focuses on B2C or B2B markets. At the same time, companies often want to learn more about their competitors, and technographic data can tell them what tools other organizations are using.
It’s also possible to analyze the R&D level of development. Technographic data is similar to demographic data but doesn’t focus on metrics like location and age. Instead, it gives information about how customers use technology.
Most common insights companies can get out of technographics
What is the reason behind segmenting a market using this method? We all know companies are adopting new approaches, data structures, and technologies only because they want to improve their processes and stay ahead of the competition.
How can technographic data help them do that? Let’s say you’re planning to offer SaaS or IaaS solutions. In that case, this kind of data can give you valuable information on how to design, promote, and sell your product to customers.
Finding new business opportunities
When scaling a business, it’s essential to recognize the right opportunities that can lead to company growth. Learning more about what technologies your customers are currently using and their potential needs can help you expand and find similar people.
You can start with a simple method by seeing what kind of phones your customers are using to contact your business. That is just basic technographic knowledge you can use to your advantage.
Improved customer retention
Customer retention is all about knowing your customers and understanding their needs. Technographics give you granular and more valuable information about customers. With this information, it’s possible to set up better personalization efforts and direct marketing approaches.
Putting in effort with your customers and showing that you want to learn about them will make them feel valued. Those customers are more likely to stay loyal to your business for an extended period.
Technographic data can show you how to start interacting with different consumers and make better market forecasts.
Data for improving productivity
Organizations often use technographics to improve services and processes. Analyzing your data process and tech stack can help you recognize weak spots within the organization. Companies that work on improving their most vulnerable areas are the ones that grow.
Understanding customer buying preferences and habits enable organizations to create better leads for their sales teams. All of that helps improve efficiency, as sales teams won’t have to waste time chasing cold leads. At the same time, it’s possible to recognize repetitive tasks that you can automate for better efficiency.
Bottom line
Companies can gather data both internally and externally. Even though most companies can keep track of their internal data, it’s sometimes impossible for organizations to quickly collect valuable data externally while ensuring it will provide the necessary value.
That’s why companies often buy technographic data or outsource this process to organizations that specialize in extracting data online with the proper knowledge and tools.
What's your reaction?

Three Prevalent Threats A...
Online shopping continues to grow as a significant part of modern commerce. Data from Forbes Advisor
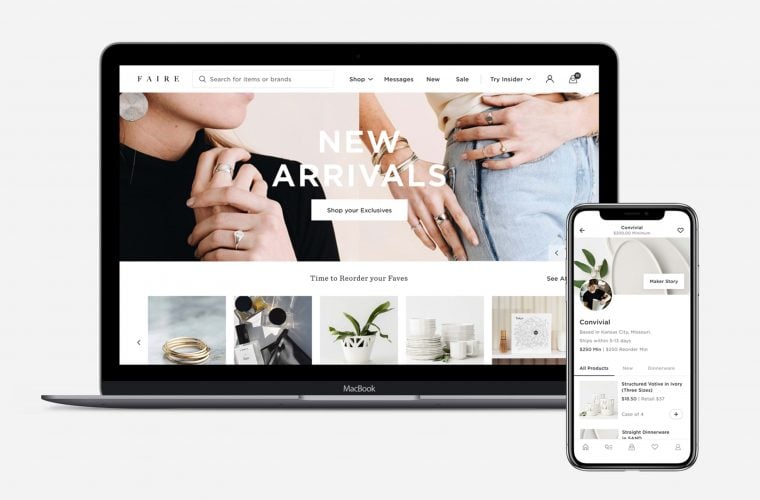
Unlock 50% Off Your First...
As an independent retailer, we know you're always on the lookout for exciting new brands and

Modern Financing Strategi...
Fluctuations in the market, rising competition, and rapid changes in technology all contribute to a tumultuous


